Newsletter – May 2024

The Share Market
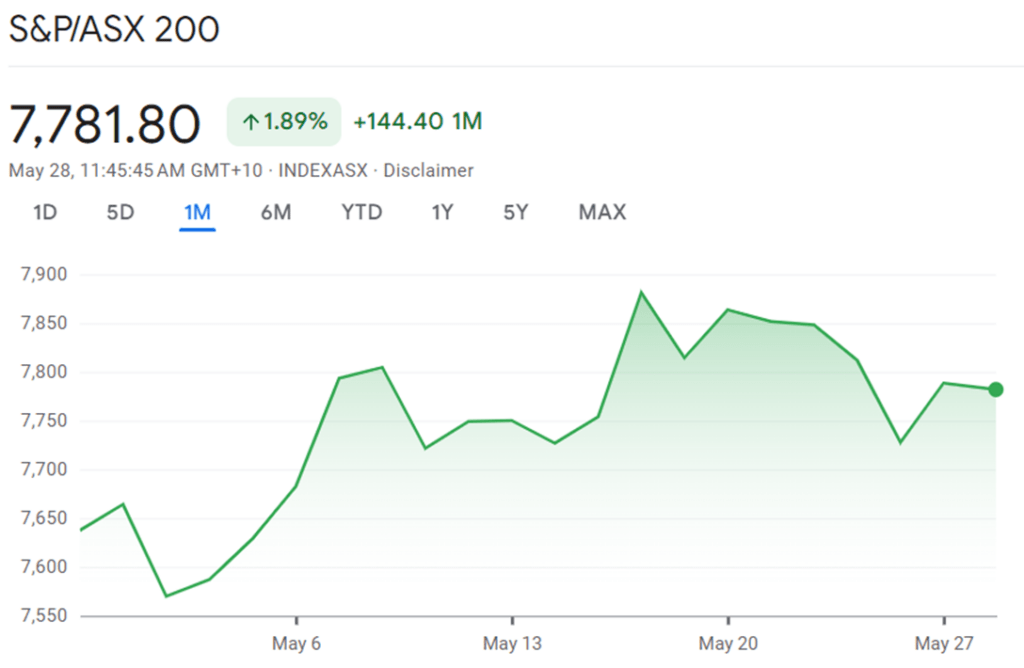
The ASX 200 index has shown a commendable performance over the past month, with an overall upward trajectory. Starting just shy of 7,650 points, the index experienced several fluctuations but maintained a positive momentum, culminating in a closing figure around 7,782 points. The peak of the graph soared above 7,800 points, indicating moments of investor optimism. Towards the end of the month, the index saw a significant surge, closing with a gain of 1.89% or an increase of 144.40 points over the month.
This positive turn of event reflects a strong investor sentiment and could be attributed to a few events, such as the rising oil prices which positively impacted ASX 200 energy shares; Rumours about Lendlease’s intention to end all international property development and sell its overseas construction divisions could have influenced the market; The softening of the gold price may have impacted ASX 200 gold mining shares.
The consistent rise despite the volatility generally suggests a resilient market with potential for future growth.

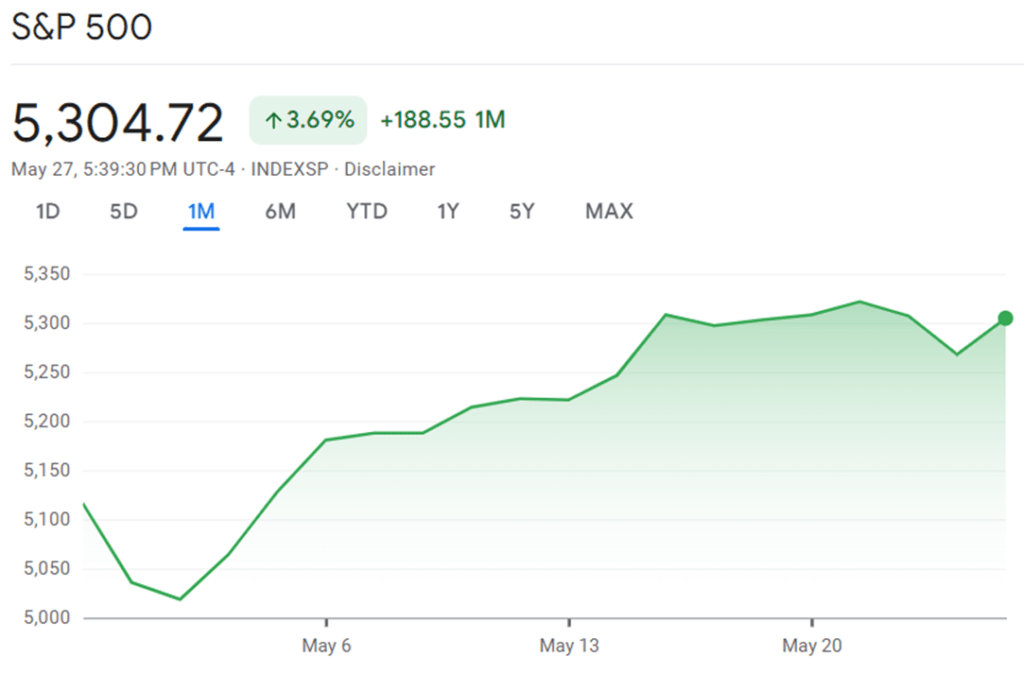
The S&P 500 index has also demonstrated a positive trend over the past month. The graph shows a steady climb with some expected market fluctuations, highlighted by a shaded area that suggests increasing investor confidence. The final data point indicates an uptick in the index’s value. This increase, represented by a 3.69% rise or a gain of 188.55 points over the month, reflects a buoyant market sentiment. Such a trend in the S&P 500 is often a good indicator of the broader economic outlook and can influence global markets, including the Australian share market.

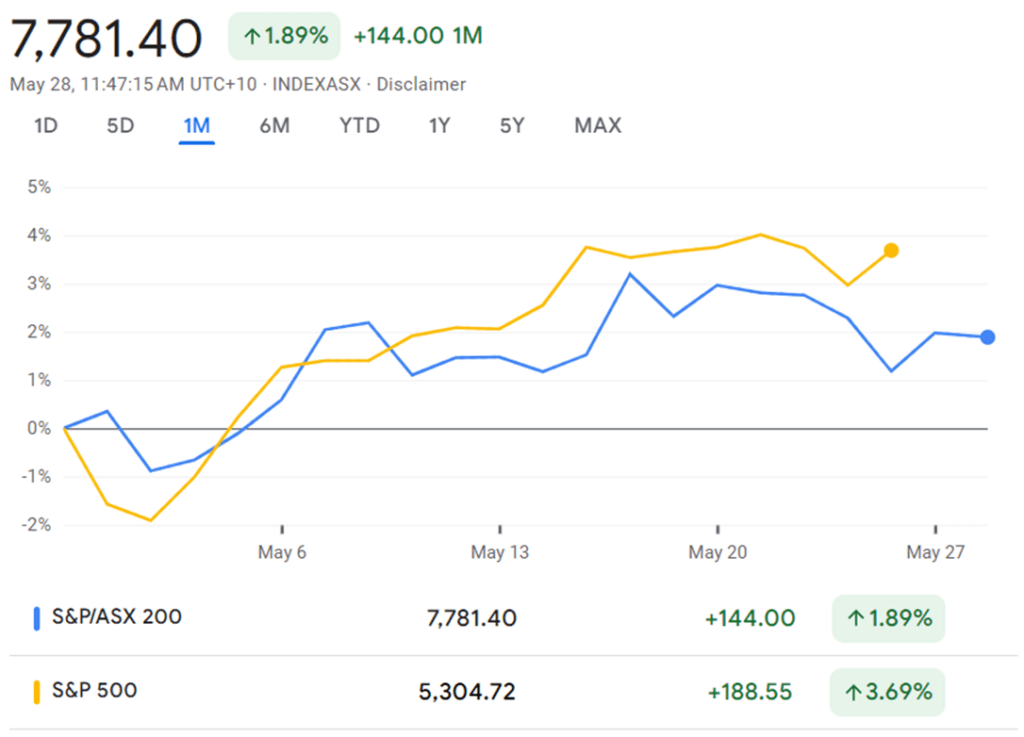
The comparison between the ASX 200 and the S&P 500 over the month of May reveals some interesting insights. While both markets are trending upward, the S&P 500, represented y the yellow line, displays a stronger performance overall.

The upward trending fluctions in both ASX200 and S&P 500 indices can be explained by a key economic theory called the Dow Theory.
The Dow Theory is a method used to analyse and understand the overall direction of the stock market. It was developed by Charles Dow, who was a co-founder of Dow Jones & Company and the first editor of The Wall Street Journal.
According to the Dow Theory, the market is in an upward trend if one of its averages advances above a previous important high, accompanied or followed by a similar advance in another corresponding average. This theory posits that the stock market moves in three trends: the primary trend (the overall direction of the market), the secondary trend (a correction to the primary trend), and the minor trend (short-term fluctuation in the market).
Let’s break this down:
When the Dow Theory talks about ‘averages’, it’s referring to stock market indices, like the ASX 200 or the S&P 500. These indices are like a snapshot of the stock market, representing a wide range of different stocks.
Now, let’s look at the phrase ‘advances above a previous important high’. This means that the value of the index has gone up and surpassed its highest point in recent history. So, if the ASX 200 was at 7,800 points last month, and now it’s at 7,900 points, it has ‘advanced above a previous important high’.
The phrase ‘accompanied or followed by a similar advance in another corresponding average’ means that another key index (like the S&P 500) also needs to show a similar upward movement. So, if the ASX 200 goes up, and then the S&P 500 also goes up, that’s a good sign that the overall market is in an upward trend.
So, in simple terms, the Dow Theory is saying that if one key stock market index goes up and reaches a new high, and another key index does the same, then the overall stock market is likely on an upward trend. This is a sign of strong investor confidence and a positive economic outlook.
An upward trend in the stock market, as indicated by the ASX 200 and S&P 500 indices, generally signals a positive environment for investors. Here’s what it could mean:
- Profit Opportunities: Investors who already own stocks or shares could see the value of their investments increase. This could potentially lead to higher profits if they decide to sell their shares.
- Confidence Boost: A rising market often boosts investor confidence. When investors are confident, they’re more likely to invest more money in the market, which can further fuel the upward trend.
- Global Influence: Trends in major indices like the S&P 500 can influence global markets, including the Australian share market. So, a positive trend in the S&P 500 could have a ripple effect on other markets around the world.
However, it’s important to remember that investing in the stock market always comes with risks. While trends can give us a general idea of market performance, they can’t predict future movements with certainty.
The Residential Property Market
Despite the backdrop of high interest rates and inflation, Australian residential property values have continued their upward trajectory in April, marking a 0.6% increase. This consistent rise, mirroring the gains of February and March, has added approximately $4,720 to the national median dwelling value, bringing the growth cycle to its 15th month with an 11.1% cumulative rise since last January’s trough, according to Corelgic’s Home Value Index Report. Let’s have a closer look at this report.
The mid-sized capitals are leading the charge, with Perth at the forefront with a 2.0% rise in April, followed by Adelaide’s 1.3% and Brisbane’s 0.9%. Sydney’s market has maintained a steady 0.4% increase over the past three months, while Melbourne has seen a slight dip of 0.1%, stabilizing after a modest decline earlier in the year. Smaller capitals like Hobart and ACT have also shown resilience, with consistent, albeit modest, increases in home values over the past three months.

Perth continues to lead with the highest monthly and quarterly growth rates, indicating a strong demand for housing in the region. The annual growth rate of 21.1% and total return of 26.8% reflect Perth’s robust market conditions.
Adelaide and Brisbane follow Perth with significant quarterly growth rates of 3.3% and 3.1%, respectively. Brisbane’s impressive annual growth rate of 16.1% showcases the city’s sustained market strength.
Sydney has seen a consistent monthly growth rate of 0.4%, contributing to a healthy annual increase in property values.
Melbourne has experienced a slight monthly decline of 0.1%, but the market has stabilised with no change over the quarter.
Hobart and Darwin show modest growth, with Hobart experiencing a slight annual decline in values.
Canberra presents a stable market with modest growth across all time frames.
Regional markets have outperformed their capital city counterparts over the past five months, with Regional WA, SA, and Queensland leading the way. However, Regional Victoria experienced a slight decline in values.
Home sales have plateaued since a peak in November last year, with current estimates showing an 8.6% increase compared to the same period last year, despite the dampening effects of affordability and low sentiment.
Nationally, rents have seen a 0.8% increase in April, with a notable rise in gross rental yields to 3.75%, the highest since October 2019. This growth, however, is tempered by seasonal factors and a peak in net overseas migration, suggesting a potential gradual easing in rental demand.
Supply and Demand Imbalance
The persistent rise in housing values can be attributed to an insufficient supply of housing relative to demand. Listings across the combined capitals are 17.6% below the five-year average, while residential sales are 2.4% higher than the average for this time of year.
This mismatch has resulted in a seller’s market, with homes selling faster and with less discounting than the decade average. The undersupply issue is recognized as a national crisis, with significant barriers to a rapid increase in housing supply, including high construction costs and labor shortages.
Vendor and buyer activity
As winter approaches, new property listings are slowing down but remain above the five-year average. Over the past month, CoreLogic tracked 38,258 new properties, an increase of almost 18% from last year and 7.7% above the five-year average. The higher level of vendor activity could be due to a combination of factors such as the previous lack of listings, rising financial pressures due to high interest rates and cost of living, or homeowners looking to cash out after significant growth in property values. Most regions have seen an increase in vendor activity compared to last year, with Melbourne and Regional Victoria standing out with the largest jumps in vendor activity.
Despite the increase in new listings, the total number of homes advertised for sale is relatively flat, tracking 3.0% lower than a year ago and almost 19% below the five-year average. However, some markets, such as Melbourne, Hobart, Regional Victoria, and Regional Tasmania, have seen an increase in total advertised properties. On the other hand, stock levels remain extremely low in some markets, particularly in Western Australia, South Australia, and Queensland. Areas of Victoria dominate the top 20 list of regions where total listings are most elevated relative to the previous five-year average. The most significant drops in total listings relative to the previous five-year average were seen in rural areas of Queensland, South Australia, and Western Australia.
Looking Ahead
Despite the risks posed by high interest rates and economic slowdown, the housing market’s resilience is likely to continue due to the ongoing supply and demand imbalance. The future of interest rates remains uncertain, with speculation of further increases amidst inflationary pressures and labor market shifts.
The Australian residential property market remains robust, defying the odds against economic headwinds. The supply shortage continues to fuel growth, suggesting that values may remain buoyant for the foreseeable future.
Inflation and Interest Rates
Australia’s economic condition is currently influenced by the balance between inflation and interest rate policy. The Reserve Bank of Australia (RBA) and the federal government, led by Treasurer Jim Chalmers, are at the forefront of addressing these challenges.
The RBA’s Monetary Policy Decision
In its latest monetary policy decision announced on 7 May, the RBA has maintained the cash rate target at 4.35%. This move is a direct response to the high level of inflation that continues to impact the cost of living across the country. Despite a moderating trend, inflation remains a significant concern, with the Consumer Price Index (CPI) steadying at 3.4% year-on-year to January. The RBA’s goal is to return inflation to its target range of 2-3% by 2025, emphasising long-term economic stabilization and enabling Australians to manage their financial futures with greater certainty.
The decision to hold rates steady comes against a backdrop of tepid household spending, influenced by inflationary pressures and previous interest rate rises. However, the RBA remains vigilant and committed to its inflation target, despite the challenges posed by the international economic landscape and the complex recovery pathways of economies like Europe and Japan.
Federal Budget’s Intersection with Monetary Policy
Treasurer Jim Chalmers’ recent federal budget intersects with the themes of inflation and interest rates in a significant way. The budget aims to combat inflation and provide cost-of-living relief while also supporting monetary policy. Measures such as $300 in energy relief for every household, medicine price restraints, and increased rent assistance are expected to moderate inflation, with forecasts indicating a reduction of 0.75 percentage points this year and 0.5 percentage points next year.
Despite these efforts, the budget does not anticipate a reduction in interest rates in the immediate future. The cash rate is assumed to gradually ease from around the middle of 2025 to reach 3.6% by the middle of 2026. This suggests that the RBA may maintain the current interest rates to ensure economic stability and prevent inflationary pressures from resurging.
Mixed Reactions
Economists have expressed mixed reactions to the budget’s impact on inflation and interest rates. Some believe that the cost-of-living measures may make it more likely for the RBA to keep rates on hold, as too much new spending could blow out the future budget deficit. Others argue that if the RBA is genuinely prepared to cut interest rates as inflation moves back towards its target, a rate cut could be expected within the year.
Overall, the federal budget by Jim Chalmers is designed to provide immediate relief from inflationary pressures while supporting the long-term goal of economic stability. The RBA is being careful with interest rates as part of a wider plan to deal with the complicated economic situation and promote lasting growth. Australia’s economic strategy is a delicate balancing act between providing immediate relief to households and maintaining a stable economic environment conducive to growth. We'll watch the RBA's cash rate decision closely, which will come out on 18 June. Stay tuned!


